학부 4학년때 "easy-A-class" 라고
소문났던 수업이여서 수강했었던..
재미 있게 들었던거 같긴한데
현재 나의 업이 될 줄은 몰랐다고한다..ㅎㅎ
당시 2015년도..
그때에 비하면 BI 분야도 많이 발전한거 같네요
지금은 BI 가 너무 재미있고 앞으로도 실력있는 bioinformatics engineer 로 성장하길 소망합니다.
그때 final paper 로 제출했던 파일을
우연히 보게 되었고 일부를 공유해봅니다...
가볍게 봐주시면 감사하겠습니다ㅎㅎ
Sunkyu Kwon
01173568
Professor Weisman
Bioinformatics
05/23/2015
Project Paper
Introduction to Bioinformatics
Bioinformatics is the field of science that studies different scientific tools used to store, retrieve, organize and analyze biological data. It is an interdisciplinary field that manages biological data to analyze an interpreted a wide range of biological information in data mining, database searches such as proteins, genes, nucleic acid sequences and more, modeling of proteins and drug design. The purpose of bioinformatics is to facilitate the study of biology through more efficient research strategies. It also plays an important role in the pharmaceutical industry in helping reduce the time frame and the cost that involved in designing new drug and in the healthcare sector is bringing new insight in personalized medical treatments.
Introduction to the Erbb2 gene
The gene I will be focusing on is the Erbb2 gene in Homo Sapiens (human). The Erbb2 gene (erb-b2 receptor tyrosine kinase 2) has many other different names such as NEU, NGL, HER2, TKR1, CD340, HER-2, MLN 19 and HER-2/neu. After all theses names, the official full name that’s mostly used is erb-b2 receptor tyrosine kinase 2. It is located on at position 12 chromosome #17. It encodes a 185 kDa transmembrane glycoprotein that belongs to the epidermal growth factor receptor (EGFR) family. (Ming Tan and Dihua Yu) The gene has a gene length of 40,523 bp with mRNA size of 4889 bp and its proteins size has 1225 amino acids. It has 32 exon and 5 isoforms that are almost identical (isoform a, isoform b, isoform c, isoform d, and isoform e). The molar percentage of guanine and cytosine bases in a sequence is quite high as 73.5%. These receptors are located on the surface of cells to form a complex. Growth factors binding to these receptors occurs the receptor complex to transmit signals inside the cells which consequently activates certain genes that promote cell interactions such as cell growth, cell adhesion, cell specialization and cell movement. (Roskoski)
The Erbb2 gene has three receptor paralogs named Erbb1, Erbb3 and Erbb4. Erbb2 is unique among these four human receptor genes and it is demonstrated that it is the closest structural relative of the single EGFR family member of Drosophila. (Roskoski) There are also many orthologs that can be found for the Erbb2 gene such as Mus musculus, Rattus norvegicus, Canis lupus familiaris, Bos taurus, Felis catus, Mesocricetus auratus, Pan troglodytes and Pongo abelii.
The overexpression of the Erbb2 plays an important role in many human cancer types like breast, lung, gastric, ovarian and also glioblastoma. Here, my final project is more focus on Erbb2 in breast cancer. Breast cancer is the second most common diagnosed cancer (after lung cancer) and second leading cause of women cancer deaths worldwide. The estimated incidence of new cases of breast cancer in the United States in 2012 was about twenty three million patients with about forty thousand patients succumbing to the disease.(Breastcancer.org) When the gene is overexpressed, it caused aggressiveness in breast tumors that are more likely to spread to other tissues in the body that is called metastasize. These changes called somatic mutation are not necessarily inherited. Somatic mutations occur when DNA makes a copy of itself replicates in preparation for cell division. (Mitri) For example, in the case of the Erbb2 when it is amplified it creates an overproduction of the Erbb2 protein, which at some point stimulates cells to grow and divide continuously. This uncontrolled cell division leads to the growth or proliferation of cancerous tumors in the breast and the body. So far, the amplification of the HER2 gene is found in almost 40% of breast cancer. (Roskoski) Despite the progress made by researchers in confirming the role of Erbb2 overexpression in breast cancer metastasis, the molecular signaling mechanisms that are responsible for Erbb2 mediated cancer metastasis remains unknown.
Through using different bioinformatics tools one can better understand the Erbb2 gene in Homo Sapiens biologically in structure as well as the possible function and consequences of alterations in this gene. The analysis uses databases and computer algorithms to understand the gene, its mRNA and the coding protein and the function. It also uses performing experiments with phylogeny to classify and understand better the evolutionary history of the gene. Its analysis performed and results for the Erbb2 gene as well as its protein are discussed in the forthcoming sections of this paper.
Bioinformatics Analysis
BLAST
In order to find homologues for a specific gene there is a bioinformatics tool online at the NCBI (National Center for Biotechnology Information) that can be used. There is a website called BLAST (Basic Local Alignment Search Tool) that searches for similarities and differences of amino acid, protein or nucleotide sequences within different or same sequences and species with numerous other databases and also calculates the statistical significance of matches. The bioinformatics analysis was used for the Erbb2 gene by running a BLAST search. In order to obtain the best result from the query, this tool allows to filters and removes low regions that contain repeats. Also, BLAST sets up with different scoring matrices so that the results can be higher or lower in score based on the given search query. (BLAST set up shown in Appendix) The search was set to the parameters of non-redundant protein sequence (nr) database and the algorithm was set to blastp (protein-protein BLAST). The algorithm parameters max target sequences was set to 100, the expect threshold was set at 10; the word size was set at 3. In terms of scoring of the BLAST, the BLOSUM 62 was applied with gap costs of existence: 10 Extension: 1, using the conditional compositional score matrix adjustment. In the particular case of the Erbb2 gene, BLAST is used to align the protein with the accession number NP_001005862. It is important to kept in mind that E-value is useful to determine the reliability of a given hit. The lower the E-value, meaning the closer to 0.0, the higher the level of confidence that a given sequence is a homologue. After the BLAST was performed the hits include paralogs (duplicates of the gene in different species) and orthologs (common ancestry). It appears to have three paralogs to be Erbb1, Erbb3, and Erbb4 all with an E-value of 0.0, which is a good indication that the match is accurate and obtained by chance. None of the paralogs seem to be pseudogenes, the underlying logic is that paralogs have similar sequence that codes for a functional protein that can perform in a similar way as the other paralogs. Whereas, the pseudogene is the similar or identical sequence but doesn’t have any function. This is due to free capacity that this gene duplication has on the genome to either evolves or simply become a pseudogene. In BLAST results, query coverage shows a percentage of the query sequence that overlaps the subject sequence showing how long piece of the sequence is covered by the one found. The higher query coverage and similarity a hit has, the higher chance of homology. In the particular case of the Erbb2 gene, many outputs have 100 percent query coverage and most of the outputs also have a high query coverage close to 100 percent. It certainly increases the level of confidence with the result. However, one can get coverage of 100 percent after the alignments with low homology or can have high homology but only on half of the sequence. BLAST allows one to make alignments of either full sequence or just fragments of sequences. It finds similarities between isolated regions so it is also important to look at the query coverage before choosing a hit as a homologue. With in E-value analysis query cover and identity percentage, there are orthologs of the Erbb2 gene appeared in diversity of species from mice to zebrafish. These orthologs also have E-value of 0.0. It indicates that the evolutionary conservation is high in the Erbb2 gene receptor. (BLAST result hits shown in Appendix)
Multiple Sequence Alignment
A multiple sequence alignment compares the entirety of sequences with other nucleotides or amino acid sequences to determine shared evolutionary origins and sequence alignment homology. In order to run a multiple alignment of the 10 hit sequences (FASTA format) from the Erbb2 gene BLAST outputs I used MUSCLE to align my sequences because it is listed as having the highest accuracy. MAFFT is supposed to be less accurate than MUSCLE, but it is recommended for fewer than 10 sequences due to the speed efficiency multiple sequence alignment compare to the other program. Default settings were used for this alignment and the output from MUSCLE seemed better than MAFFT alignments. After the run by using MUSCLE, first thing I noticed was that the results are displayed in a different order that is different from the way the FASTA sequences are entered. In the MUSCLE results, it also has an option for showing colors which allows to easily localize which amino acids are conserved. Whereas, MAFFT doesn’t have the option of showing color but it provides the option to view the results in multiple formats. Both use asterisks, double-dots and dot symbols at the bottom of the alignment to indicate conserved amino acid. MUSCLE aligns all the initial methionine residues at the beginning of the sequence whereas MAFFT doesn’t get the part. It generates different numbers of indels at the beginning of each sequence and the “M-“ doesn’t align. Because of the reason the rest of the alignment differs in some places where there are indels, however most of the highly conserved regions match up from one alignment to the other. There are large areas that are strongly conserved across the 10 sequences with little to no change in amino acid these occur throughout most of the middle of the protein. The protein has fewer and shorter conserved sequences toward the end of the protein. The largest indel sequences are near the end of the protein. There are also short indels of different lengths near the beginning of the protein for each sequence; the largest of which starts at position 1 and ends at position 27. Overall, the output scores come out very high, with all sequences being in the red. Therefore, one can conclude that Erbb2 gene has undergo change throughout its evolutionary history, but the evolutionary divergence within species is mostly minimal. The high identity values indicate that the gene has stayed mostly conserved throughout evolution.
Phylogeny
Phylogenetic analysis is a useful tool in helping to identify the evolutionary history of a particular protein or sequence and finding the genetic relationship between the organisms compared. Phylogeny.fr is used as the website to generate the phylogenetic analysis. It processes by taking user input sequences related to each other evolutionarily and runs them through multiple sequence alignments, curates the alignments and constructs the alignment to make a tree based on maximum likelihood of homologous sequences. In order to create a meaningful and informative tress, an outgroup sequence must be included. An outgroup is an organism that is evolutionarily similar, yet distantly enough to be classified in the root of the tree. The first step for drawing the tree is to choose the program called “A la Carte”. This program consists of a phylogeny workflow that creates the final phylogenetic tree step by step. The processing steps are selected as MUSCLE because I choose the MUSCLE program for multiple alignments of my gene’s protein sequences because of its biological accuracy and its stability. Also, I used it to align my selected FASTA sequenced. (13 selected protein sequences shown in Appendix) I choose Gblocks program for alignment curation because it helps eliminate regions that are diverged and poor aligned positions. I choose Maximum Likehood (PhyML) program for construction of phylogenetic tree because of its flexibility and its speed performance for my sequences and it would be able to give me a statistical model of the evolutionary change that might varies across the branches of my tree including the negative and the positive selection from my sequences. To make the phylogeny tree, 13 different protein sequences from different species were used as FASTA sequences from NCBI. (Gblocks result shown in Appendix)
I identified an outgroup for my phylogeny: Rattus norvegicus (accession number NP_058699.2), (receptor tyrosine kinaseerbB2). The reason why I choose this outgroup is because it is the most distantly related to the original gene. Thus, this outgroup would be located on the second branch of the monophyletic group, farther from the main gene, but of course would still share a common ancestor. The alignment step is essentially the step where multiple alignments of the amino acids happen by using the MUSCLE program. In this alignment step the MUSCLE program has aligned the all the sequences included the ones for the outgroup added by showing some insertions an deletions location, plus it also highlighted in different colors (green and purple) the event that I happened during the alignment. The colors mean the level of conservation in the amino acids. The confidence level is the level of support for the particular node where 1 is basically the maximum amount of support. So in my tree the confidence level is high enough towards the root of the tree (shown 1 as maximum) and it gradually lowers in values (1 –> 0.733 –> 0.933) as it moves deeper into the tree indicated less support for the nodes the values drops indicating a drop in support as you go further into the tree. However, as towards the end of the tree (where cases of Homo Sapiens) the value increases again (–> 0.933). The evolutionary distances shows the relationships between a group of proteins which can show the evolutionary ties between the proteins in the tree and it can be used to see how long it took for the species to diverge from the most recent common ancestor. The final output tree indicates a starting node which leads into two main monophyletic groups, one leads and contains the outgroup, the other one contains the original protein (receptor tyrosine-protein kinase erbB-2 isoform b [Homo Sapiens], NP_001005862). This main branch then divides into one of which is divided again into many other sub branches indicating a lot of relationships and similaries between the proteins. The biological meaning is that the proteins have the same common ancestor, but with mutations and evolutions that occur later one with time caused the proteins to diverge. Based on the bootstrapping values as well as the values in the phylogenetic tree, this divergence happens with the high level of confidence because they are mostly closer to 1. This is a good indication that based on an analysis using this gene protein the species within each of the clades are more closely related to each other than they are in other clades (Figure 1 in Appendix)
Conserved Domain Analysis
To analyze the gene in depth a conserved domain this was done by using CDD. The Erbb2 gene has seven conserved domains and one of the interesting domains in the protein was chosen. It was the Receptor L domain; pfam0103. I choose that domain because it is pretty conserved and it encoded my protein. The amino acid range of this domain is 22-143 and its CD length is 279 bp. The L domain protein from these receptors makes up the bilobal ligand binding site that helps binding to other ligand-bound EGFR receptor family members forming a heterodimer. It also stabilizes the ligand binding and improves kinase-signaling pathways. (NCBI CDD)
3D Structure and Homology Model
Protein Data Bank is an online database that specializes in finding the 3D structure of protein domains and plausible homolog structures that are similar to user input. This analysis tool site was used to get a 3D structure of the protein domain. The FASTA sequence was used into the search bar. After searching my domain sequence in the search bar, it didn't find the exact protein in the results instead it gave several very similar 3D structures of my protein domain and informative homologs. It showed that the domain had plausible homologs in Mus musculus and Homo Sapiens (two cases found). They respectively had an E-value of 7.52654E-9, 6.01012E-8 and 3.52551E-6, a PDB identifier of 4F3L, 4H6J and 1P97, there structures where elucidated by X-ray diffraction and NMR and had a resolution of 2.27 Å, 1.52 Å and no resolution respectively. (Figure2 and 3 in Appendix)
Phyre is a website that is used to predict protein structures and was used to construct a homology model. The FASTA file of my domain amino acid sequence was used with the modeling setting set to look at the 3D images. Using Protein Workshop, the 3D images were rotated to a very different orientation. The top three templates used in building the homology model with the highest confidence levels were,
1) Template1 - Crystal structure of the single-chain fv (scfv) fragment of an anti-2 erbb2 antibody cha21 in complex with residues 1-192 of erbb23 extracellular domain, Confidence: 100.0, % identity: 100
2) Template2 - Dual specific bh1 fab in complex with the extracellular domain of2 her2/erbb-2, Confidence: 100.0, % identity: 100
3) Template3 - Structure of the her3 (erbb3) extracellular domain, Confidence: 100.0, % identity: 51
(Figure5 in Appendix)
The first two templates that are perfect homologs with confidence scores of 100 and a high alignment coverage indicating they match well to my protein. However, the third template, (Structure of the her3 (erbb3) extracellular domain) is not a homolog to my gene because of the relatively low identity percentage. The main differences between my gene sequence and the templates are the additions or deletions in amino acids. Another important thing is the change in amino acids, which is well noted in the comparison. In some cases the beta strands are like duplicated, there’s difference in length. In the case of alpha helixes in the template, they look very conserved with not much change at all. From the catalytic residues on the template, it is noted that they are very highly conserved and looks like some insertion occurred on the template sequence.
Microarray Analysis
Microarray analysis allows one to measure the various cases of genes that are differently expressed. I was able to find microarray experiments regarding my gene by using the NCBI GEO (Gene Expression Omnibus) database. I searched for gene profiles for my gene, Erbb2, by using this bioinformatics analysis tool. I used several meaningful keywords such as Erbb2, EGFR, HER-2, breast cancer and Homo Sapiens to narrow down my results. The result gave me many hits and three profiles out of the hits choose in which the Erbb2 gene being differentially expressed.
The first microarray gene profiles is titled ERBB2 - Estrogen receptor alpha-silenced MCF7 breast cancer cells regarding the investigation of the MCF7 breast cancer cells after siRNA mediated silencing of the estrogen receptor α (ERα). In this experiment, Affymetrix microarray was used which covers the human genome set plus many additional genes for analysis of over thousands transcripts. The loss of estrogen receptor α is responsible for the estrogen/tamoxifen resistant cells (pII) in breast cancer. This results in altering morphology and molecular events related to the endocrine drug resistant phenotype in breast cancer. The second microarray gene profiles is titled Erbb2 - ErbB2/Neu and luteinizing hormone overexpression effect on the mammary gland. In this experiment, comparative microarray analysis was performed for 5- to 10-week bitransgenic mammary glands (LHxMMTV-neu) in triplicate in order to identify genes that may facilitate early steps of ErbB2/Neu-mediated mammary tumorigenesis. The experiment was done by analyzing three different pooled RNA samples that represented 3 different animals for each time point so that a total of 9 bitranspgenic mice were used. The conclusion showed that there’s effect of chronic trophic maintenance of the mammary epithelial cells on ErbB2/Neu-initiated tumorigenesis induced by LH. The third microarray gene profiles is named Endoplasmic reticulum membrane-associated genes in breast cancer cell line MCF-7. This experiment was focused on identifying mRNA genes that are translated from the endoplasmic reticulum (ER) in the MCF7 breast cancer cell. The mRNA from MCF7 cells was derived by using sucrose density gradient centrifugation. Affymetrix microarray is also used in this experiment. This step has done to separate RNA associated with membrane-bound polysomes from ones associated with free polysomes because it is known that only RNA associated with membrane-bound polysomes are selectively translated in the ER. The result showed close relationship between those membrane-bound associated proteins and breast cancer cells. (NCBI (GEO)) (Figure 9 – 11 in Appendix)
Network Analysis
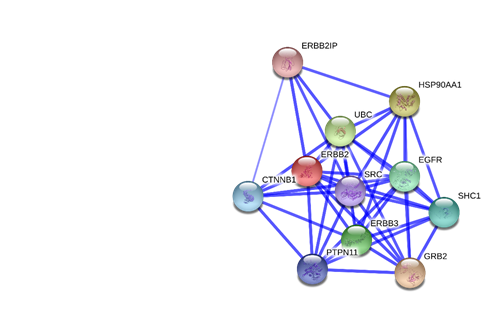
A network analysis was performed on the Erbb2 gene by using StringDB (string-db.org), which is an online database that generates multiple views (confidence, evidence and actions) on interactions of certain genes to other genes. The search in StringDB showed ten interactions of high scoring functional partner genes of Erbb2. (GRB2, HSP90AA1, UBC, ERBB3, EGFR, SHC1, CTNNB1, PTPN11, SRC, and ERBB2IP) The Erbb2 gene is connected throughout the rest of the genes with several lines indicating that they have certain things in common; mostly experiment (purple line) and databases evidences (light blue) between the interacting genes. The Erbb2 gene and the Erbb3 gene have co-express with a score of 0.99 in homology column. Since the Erbb3 gene is a member of the EGFR family as well as the Erbb2 gene, it makes sense to see good evidences between Erbb2 gene and Erbb3 gene. The Erbb3 gene is activated by neuregulins and NTAK and binds to the Erbb2 gene. In the Erbb2 gene, protein tyrosine kinase needs a coreceptor for ligand binding. Neuregulins do not interact with it alone. It interacts with certain potential ligands in neuregulin-receptor complex. Consequently, the Erbb2 gene is texmining in all the other genes in the network. It also can be seen that is has textmining evidence where they are both mentioned in multiple publications. The confidence level is also 0.999. The network analysis shows that the Erbb2 gene has interactions with ten other genes. The result shows that the Erbb3 gene is the preferred partner for Erbb2 gene because it is the most biologically active dimmer among all the Erbb dimerization complexes. The action view shows similarities via color. There are some similarities between the Erbb2 and the Erbb3. They have in common is binding (blue) and Expression (yellow). The confidence view shows the level of confidence for each interaction between genes, which shows how strong the association is by how thick the blue line is. The confidence score between the Erbb2 and the Erbb3 is 0.999. (Figure 12 – 17 in Appendix)
Conclusion
The field of bioinformatics certainly helped me to understand and study the Erbb2 gene by using analysis tools such as NCBI, BLAST, MUSCLE, G-Blocks, PhyMl and PDB. NCBI was used to find basic general information about the Erbb2 gene protein such as its location, length and mRNA size etc. It also provided the homologs, paralogs and orthologs by using BLAST along the accession number and FASTA sequences which where used to research the gene more deeply by processing the FASTA sequences of the homologs through MUSCLE and G-Block to align and curate the sequence that was then used to create a phylogenetic tree which showed how the gene evolved over time across different species. I was able to find the conserved domain of the protein through NCBI and its FASTA sequence was used to create the protein models. Next the microarray analysis was performed finding various informative experiments related to the Erbb2 gene by using NCBI GEO database. The network analysis was also performed to generate multiple views to see how the Erbb2 gene interacts with other genes. Consequently the information collected from using and analyzing these tools allowed a greater understanding of the gene. This information can be used in future research to create medications and drugs to mutate Erbb2 receptors to repel cancer cells and to create better treatments for those who are dealing with breast cancers as well as other types of cancers related to the Erbb2 gene. Breast cancer cells are able to rapidly mutate. Because of this characteristic of cancer cells they are adapted to its environment making it one the most difficult viruses to fight. The mutation of the Erbb2 gene plays an important role in breast cancer. I think the feature of the tumor cells can be used to eliminate the virus by researching how other Erbb2 mutations across species fight certain strains of tumor cells allowing to better understand the cancer cells and Erbb2 receptor. This process then can be performed by using tools and algorithms to collect and generate specific detailed information with the help of bioinformatics.
Reference
1) Ming Tan and Dihua Yu . Molecular Mechanisms of ErbB2-Mediated Breast Cancer Chemoresistance. http://www.ncbi.nlm.nih.gov/books/NBK6194/ April 2015
2) "ERBB2 Erb-b2 Receptor Tyrosine Kinase 2 [ Homo Sapiens (human) ]." National Center for Biotechnology Information. NCBI, n.d. Web. May 2015
3) "Exquisite Sensitivity of TP53 Mutant and Basal Breast Cancers to a Dose-dense Epirubicin-cyclophosphamide Regimen." National Center for Biotechnology Information. U.S. National Library of Medicine, n.d. Web. May 2015
4) Mitri Z, Constantine T, O'Regan R (2012). "The HER2 Receptor in Breast Cancer: Pathophysiology, Clinical Use, and New Advances in Therapy" April 2015
5) Coussens L, Yang-Feng TL, Liao YC, Chen E, Gray A, McGrath J et al. (December 1985). "Tyrosine kinase receptor with extensive homology to EGF receptor shares chromosomal location with neu oncogene" May 2015
6) Edgar RC. MUSCLE: multiple sequence alignment with high accuracy and high throughput. Nucleic Acids Res. 2004. May 2015
7) Guindon S., Dufayard J.F., Lefort V, Hordijk W., Gascuel O. New Algorithms and Methods to Estimate Maximum-Likelihood Phylogenies: Assessing the Performance of PhyML 3.0. Syst Biol. 2010. May 2015
8) Roskoski, Robert, Jr. "Pharmacological Research." The ErbB/HER Family of Protein-tyrosine Kinases and Cancer (2013): n. pag. May 2015
9) "Cell Division and Cancer.” Scitable. Nature Education, n.d. Web. May 2015.
10) Burgess AW, Cho HS, Eigenbrot C, Ferguson KM, et al. An open and-shut case? Recent insights into the activation of EGF/ErbB receptors. Mol Cell 2003 May 2015.
11) U.S. Breast Cancer Statistics." Breastcancer.org. 1 May 2015. Web. 22 May 2015.
12) Schlessinger J. Ligand-induced, receptor-mediated dimerization and activation of EGF receptor. Cell 2002 May 2015.
13) Pinkas-Kramarski R, Soussan L, Waterman H et al. Diversification of Neu differentiation factor and epidermal growth factor signaling by combinatorial receptor interactions. 1996. May 2015.
14) Alvarado, D., Klein, D. E., Lemmon, M. A. ErbB2 resembles an autoinhibited invertebrate epidermal growth factor receptor. Nature 2009. May 2015
15) NCBI - http://www.ncbi.nlm.nih.gov
16) BLAST - http://blast.ncbi.nlm.nih.gov/Blast.cgi
17) MUSCLE - http://www.ebi.ac.uk/Tools/msa/muscle
18) NCBI (CDD) - http://www.ncbi.nlm.nih.gov/Structure/cdd/cdd.shtml
19) NCBI (GEO) - http://www.ncbi.nlm.nih.gov/geoprofiles
20) Phylogeny.fr - http://www.phylogeny.fr
21) Phyre2 - http://www.sbg.bio.ic.ac.uk/phyre2
22) Protein Database Bank (PDB) - http://www.pdb.org
23) SMART Database - http://smart.embl-heidelberg.de
24) STRING 9.0 Databasev (StringDB)- http://string-db.org/
Template1(shown in Figure5) - http://www.sbg.bio.ic.ac.uk/phyre2/html/flibview.cgi?pdb=c3h3bA_
Template2(shown in Figure5) - http://www.sbg.bio.ic.ac.uk/phyre2/html/flibview.cgi?pdb=c3be1A_
Template3(shown in Figure5) - http://www.sbg.bio.ic.ac.uk/phyre2/html/flibview.cgi?pdb=c1m6bB_
Figure9 (profile1) - http://www.ncbi.nlm.nih.gov/geoprofiles/77629753
Figure10 (profile2) - http://www.ncbi.nlm.nih.gov/geoprofiles/22230852
Figure11 (profile3) - http://www.ncbi.nlm.nih.gov/geoprofiles/8890806
Appendix
Blast Setup
BLAST hits
Protein sequences
Gblocks results
Figure 1 - 17
Blast Setup
NP_001005862:receptor tyrosine-protein kinase
Query ID
gi|54792098|ref|NP_001005862.1|
Description
receptor tyrosine-protein kinase erbB-2 isoform b [Homo Sapiens]
Molecule type
amino acid
Query Length
1225
Database Name
nr
Description
All non-redundant GenBank CDS translations+PDB+SwissProt+PIR+PRF excluding environmental samples from WGS projects
Program
BLASTP 2.2.31
Outputs of sequences producing alignments (10 of the BLAST hits)
|NP_001005862.1|receptor tyrosine-protein kinase erbB-2 isoform b [Homo Sapiens]
2528 2528 100% 0.0 100% NP_001005862.1
|NP_004439.2| receptor tyrosine-protein kinase erbB-2 isoform a precursor [Homo Sapiens]
2526 2526 100% 0.0 100% NP_004439.2
|NP_001276865.1| receptor tyrosine-protein kinase erbB-2 isoform c [Homo Sapiens]
2524 2524 100% 0.0 100% NP_001276865.1
receptor tyrosine-protein kinase erbB-2 precursor [Bos taurus]
2300 2300 100% 0.0 92% NP_001290558.1
|NP_001041628.1| receptor tyrosine-protein kinase erbB-2 precursor [Felis catus]
2298 2298 100% 0.0 94% NP_001041628.1
|NP_001003217.1| receptor tyrosine-protein kinase erbB-2 precursor [Canis lupus familiaris]
2292 2292 100% 0.0 92% NP_001003217.1
|NP_001268310.1| receptor tyrosine-protein kinase erbB-2 precursor [Mesocricetus auratus]
2197 2197 100% 0.0 88% NP_001268310.1
|NP_001003817.1| receptor tyrosine-protein kinase erbB-2 precursor [Mus musculus]
2165 2165 100% 0.0 88% NP_001003817.1
erb-b2 receptor tyrosine kinase 2 precursor [Xenopus laevis]
1412 1412 99% 0.0 58% NP_001089062.1
receptor tyrosine-protein kinase erbB-2 isoform e [Homo Sapiens]
1257 1257 49% 0.0 100% NP_001276867.1
13 protein sequences used to make a phylogenic tree
receptor tyrosine-protein kinase erbB-2 isoform b [Homo Sapiens]
receptor tyrosine-protein kinase erbB-2 isoform a precursor [Homo Sapiens]
receptor tyrosine-protein kinase erbB-2 isoform c [Homo Sapiens]
Receptor tyrosine-protein kinase erbB-2 [Macaca mulatta]
v-erb-b2 erythroblastic leukemia viral oncogene-like protein 2 [Ursus americanus]
v-erb-b2 avian erythroblastic leukemia viral oncogene-like protein 2 [Sus scrofa domesticus]
receptor tyrosine-protein kinase erbB-2 [Camelus ferus]
receptor tyrosine-protein kinase erbB-2 precursor [Bos taurus]
receptor tyrosine-protein kinase erbB-2 precursor [Felis catus]
ERBB2 [Tupaia chinensis]
receptor tyrosine-protein kinase erbB-2 precursor [Mesocricetus auratus]
receptor tyrosine-protein kinase erbB-2 precursor [Rattus norvegicus]
receptor tyrosine-protein kinase erbB-2 precursor [Mus musculus]

Figure1
Gblocks 0.91b Results
Processed file: input.fasta
Number of sequences: 13
Alignment assumed to be: Protein
New number of positions: 816 (selected positions are underlined in blue)
10 20 30 40 50 60 =========+=========+=========+=========+=========+=========+ Tupaia_chinensi -----MELAALCLWGLLFAVLPPGAAGTQVCTGTDMKQRPPASPETHLDMLRHLYQGCQV Macaca_mulatta] -----MELAAWYRWGLLLALLPPGAAGTQVCTGTDMKLRLPASPETHLDMLRHLYQGCQV isoform_a_precu -----MELAALCRWGLLLALLPPGAASTQVCTGTDMKLRLPASPETHLDMLRHLYQGCQV isoform_c_[Homo -----MPRGSW---------KPQ------VCTGTDMKLRLPASPETHLDMLRHLYQGCQV isoform_b_[Homo -----------------------------------MKLRLPASPETHLDMLRHLYQGCQV Ursus_americanu -----MELAAWCRWGLLLALLPSGAAGTQVCTGTDMKLRLPASPETHLDMLRHLYQACQV Felis_catus] -----MELAAWCRWGLLLALLPSGATGTQVCTGTDMKLRLPASPETHLDMLRHLYQGCQV Sus_scrofa_dome -----MELAAWCRWGLLLALLPPGAASTQVCTGTDMKLQLPASPETHLDMLRHLYQGCQV Camelus_ferus] MSVFLLSPPVWQGTEGRSGAEARGTYRAVVCTGTDMKLRLPASPETHLDMLRYLYQGCQV Bos_taurus] -----MELAAWCRWGLLLALLPPGAAGTQVCTGTDMKLRLPASPETHLDMLRHLYQGCQV Mesocricetus_au -----MELAAWCGWGLLLALLSPGASGTQVCTGTDMKLRLPASPETHLDIVRHLYQGCQV Rattus_norvegic --MIIMELAAWCRWGFLLALLPPGIAGTQVCTGTDMKLRLPASPETHLDMLRHLYQGCQV Mus_musculus] -----MELAAWCRWGFLLALLSPGAAGTQVCTGTDMKLRLPASPETHLDMLRHLYQGCQV ######################### 70 80 90 100 110 120 =========+=========+=========+=========+=========+=========+ Tupaia_chinensi VQGNLELTYLPANASLSFLQDIQEVQGYVLIAHNRVRQVPLQRLRIVRGTQLFEDSYALA Macaca_mulatta] VQGNLELTYLPTNASLSFLQDIQEVQGYVLIAHNQVRQVPLQRLRIVRGTQLFEDNYALA isoform_a_precu VQGNLELTYLPTNASLSFLQDIQEVQGYVLIAHNQVRQVPLQRLRIVRGTQLFEDNYALA isoform_c_[Homo VQGNLELTYLPTNASLSFLQDIQEVQGYVLIAHNQVRQVPLQRLRIVRGTQLFEDNYALA isoform_b_[Homo VQGNLELTYLPTNASLSFLQDIQEVQGYVLIAHNQVRQVPLQRLRIVRGTQLFEDNYALA Ursus_americanu VQGNLELTYLPANASLSFLQDIQEVQGYVLIAHSQVRQVPLQRLRIVRGTQLFEDNYALA Felis_catus] VQGNLELTYLHANASLSFLQDIQEVQGYVLIAHNQVKQVPLQRLRIVRGTQLFEDNYALA Sus_scrofa_dome VQGNLELTYLPANANLFFLQEIQEVQGYVLIAHNRVSRVPLQRLRIVRGTQLFEDRYALA Camelus_ferus] VQGNLELTYLPANASLSFLQDIQEVQGYVLIAHNQVSRVPLQRLRIVRGTQLFEDNYALA Bos_taurus] VQGNLELTYLPADASLSFLQEIQEVQGYVLIAHNRVSQVPLQRLRIVRGTQLFEEHYALA Mesocricetus_au VQGNLELTYLPANATLSFLQDIQEVQGYMLIAHSQVRHVPLQRLRIVRGTQLFEDKYALA Rattus_norvegic VQGNLELTYVPANASLSFLQDIQEVQGYMLIAHNQVKRVPLQRLRIVRGTQLFEDKYALA Mus_musculus] VQGNLELTYLPANASLSFLQDIQEVQGYMLIAHNRVKHVPLQRLRIVRGTQLFEDKYALA ############################################################ 130 140 150 160 170 180 =========+=========+=========+=========+=========+=========+ Tupaia_chinensi VLDNGDPLDNASPSM-GSAPAGLRELQLRSLTEILKGGVLIQRNPQLCYQDTILWKDIFH Macaca_mulatta] VLDNGDPLNNTTPVT-GASPGGLRELQLRSLTEILKGGVLIQRNPQLCYQDTILWKDIFH isoform_a_precu VLDNGDPLNNTTPVT-GASPGGLRELQLRSLTEILKGGVLIQRNPQLCYQDTILWKDIFH isoform_c_[Homo VLDNGDPLNNTTPVT-GASPGGLRELQLRSLTEILKGGVLIQRNPQLCYQDTILWKDIFH isoform_b_[Homo VLDNGDPLNNTTPVT-GASPGGLRELQLRSLTEILKGGVLIQRNPQLCYQDTILWKDIFH Ursus_americanu VLDNGEPPKGDTSVA-GATPGGLRELQLRSLTEILKGGVLIQRNPQLCHQDTILWKDIFH Felis_catus] VLDNGDPLKNTTPVT-GASPGGLRELQLRSLTEILKGGVLIQRNPQLCYQDTILWKDIFH Sus_scrofa_dome VLDNGDLLESATPAA-GAAAEGLQELQLQSLTEILKGGVLIQRNPQLCHQDTILWKDIFH Camelus_ferus] VLDNADLLESATPAV-GATPGGLQELQLRSLTEILKGGVLIQRNPQLCYQDTILWKDIFH Bos_taurus] VLDNGDFLESAAPAA-GTAPGGLQELQLRSLTEILKGGVLIQRNPQLCHQDTILWEDIFH Mesocricetus_au VLDNRDPLDNVTTAT-GRTPEGLRELQLRSLTEILKGGVLIRGNPQLCYQDTVLWKDVFR Rattus_norvegic VLDNRDPQDNVAASTPGRTPEGLRELQLRSLTEILKGGVLIRGNPQLCYQDMVLWKDVFR Mus_musculus] VLDNRDPLDNVTTAAPGRTPEGLRELQLRSLTEILKGGVLIRGNPQLCYQDMVLWKDVLR ############### ############################################ 190 200 210 220 230 240 =========+=========+=========+=========+=========+=========+ Tupaia_chinensi KNNQLARTLVDTNRSRACGPCAPACPAAHCWGESPQDCQSLTRTVCAVGCARCKGPLPTD Macaca_mulatta] KNNQLALTLIDTNRSRACHPCSPVCKGSRCWGESSEDCQSLTRTVCAGGCARCKGPLPTD isoform_a_precu KNNQLALTLIDTNRSRACHPCSPMCKGSRCWGESSEDCQSLTRTVCAGGCARCKGPLPTD isoform_c_[Homo KNNQLALTLIDTNRSRACHPCSPMCKGSRCWGESSEDCQSLTRTVCAGGCARCKGPLPTD isoform_b_[Homo KNNQLALTLIDTNRSRACHPCSPMCKGSRCWGESSEDCQSLTRTVCAGGCARCKGPLPTD Ursus_americanu KNNQLALTLIDTNRSRACQPCSPACKDPHCWGASSGDCQSLTRTVCAGGCARCKGPKPTD Felis_catus] KNNQLALTLIDTNRSRACHPCSPMCEGSRCWGESSEDCQSLTRTVCAGGCARCKGPLPTD Sus_scrofa_dome KNNPLTTVAVEANRSRACPPCSPACKASHCWGESSKDCQSLTRTICAGGCARCKGPLPTD Camelus_ferus] KNNQPALMLIDTNRSR-----------------------DLTGTVCASGCARCKGPQPTD Bos_taurus] KNNQLPLKQIDTNRSRACAPCSPACKAPNCWGESSQDCQSLTRTVCASGCARCKGPQPTD Mesocricetus_au KNNQLAPVDIDTNRSRACPPCAPACKDNHCWGASPEDCQTLTGTIAPRAVPAARARLPTD Rattus_norvegic KNNQLAPVDIDTNRSRACPPCAPACKDNHCWGESPEDCQILTGTICTSGCARCKGRLPTD Mus_musculus] KNNQLAPVDMDTNRSRACPPCAPTCKDNHCWGESPEDCQILTGTICTSGCARCKGRLPTD ################ #################### 250 260 270 280 290 300 =========+=========+=========+=========+=========+=========+ Tupaia_chinensi CCHEQCAAGCTGPKHSDCLACLHFNHSGICELHCPALVTYNTDTFESVPNPEGRYTFGAS Macaca_mulatta] CCHEQCAAGCTGPKHSDCLACLHFNHSGICELHCPALVTYNTDTFESMPNPEGRYTFGAS isoform_a_precu CCHEQCAAGCTGPKHSDCLACLHFNHSGICELHCPALVTYNTDTFESMPNPEGRYTFGAS <a h

Figure2

Figure3

Figure4

Figure5

Figure6

Figure7

Figure8

Figure9
Tittle: ERBB2 - Estrogen receptor alpha-silenced MCF7 breast cancer cells
Annotation: ERBB2, v-erb-b2 avian erythroblastic leukemia viral oncogene homolog 2
Organism: Homo Sapiens
Profile: GPL570, 216836_s_at (ID_REF), GDS4061, 2064 (Gene ID), X03363
DataSet type: Expression profiling by array, transformed count, 6 samples

Evidence View (Figure12)

Figure13

Actions View(Figure14)
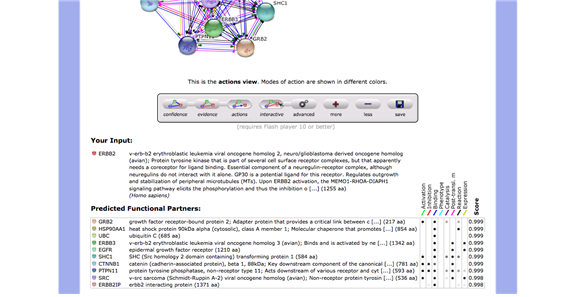
Figure15
Confidence View (Figure16)
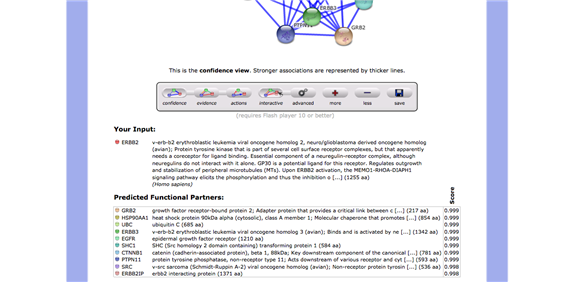
Figure17
'Bioinformatics' 카테고리의 다른 글
| [Samtools] [Bedtools] BAM to FASTQ 파일 전환 (0) | 2023.01.19 |
|---|---|
| [Bedtools] BAM to BED 파일 전환 (1) | 2023.01.16 |
| [Bedtools] BED 파일 내 overlap 영역 찾기 (0) | 2022.12.28 |
| [Bedtools] fasta 파일에서 특정 영역 추출하기 (1) | 2022.10.04 |
| CopywriteR code complete (0) | 2022.09.30 |


